


Spectrum Analysis
| Contents |
Utility of the spectrum analysis tool
The Spectrum Analysis tool can be used to visualize class formatted files (.30m, .bur, etc....), fits files, CASSIS formatted files, and identify the lines in the spectra. The headers are read and the spectrum is displayed in the graphical interface. All the species present in the databases can be displayed accordingly as tick marks and consequently show the location of those potential species in the spectrum. Lines in the spectrum can therefore be identified easily.
How does it work?
There are two ways to display a spectrum with this tool:
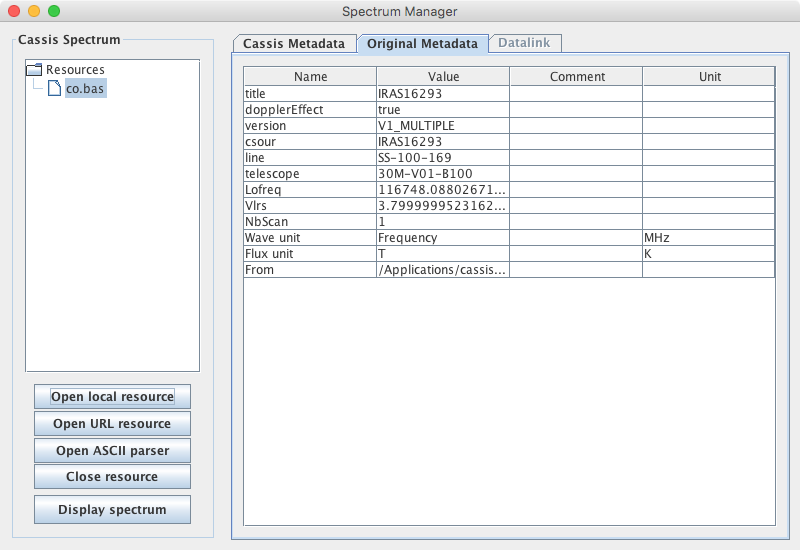
- Open the Spectrum Manager (Modules > Spectrum Manager or
click on the icon
 )
)
- click on "Open local resource"
- by default, you should be in CASSIS folder > delivery > data (if not go to this directory)
- select "CO.bas"
- click on "Display spectrum"
- Click on the third menu, Modules, and choose Spectrum Analysis.
Alternatively, click on the icon
 .
In both cases, a pop-up window opens :
.
In both cases, a pop-up window opens :
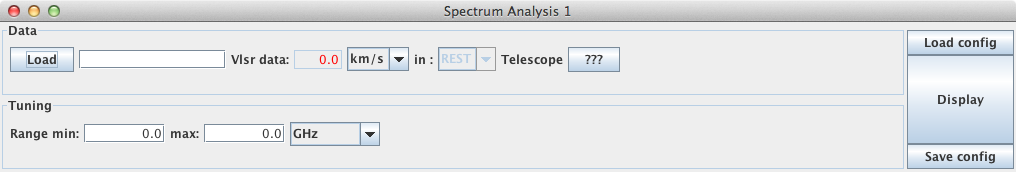
- click on "Load": this opens the Spectrum Manager
- click on "Open local resource"
- by default, you should be in CASSIS folder > delivery > data (if not go to this directory)
- select "CO.bas"
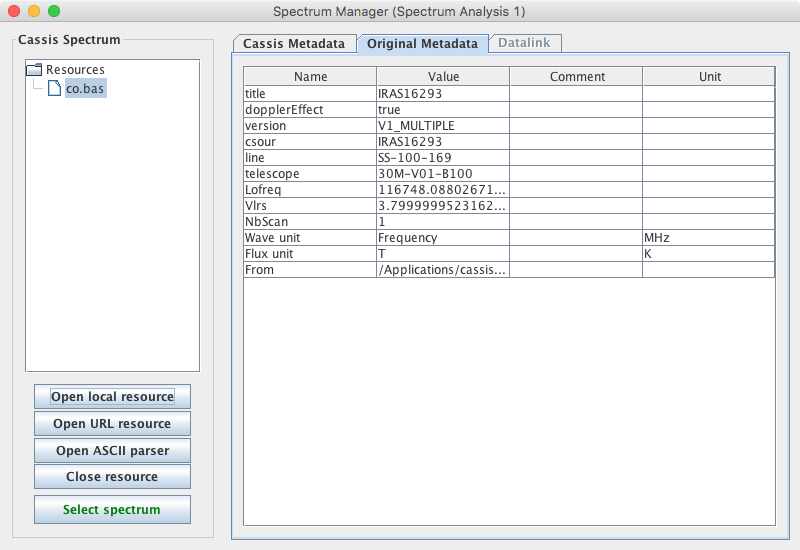
- click on "Select spectrum": this sends the spectrum to the Spectrum Analysis window
In the "Tuning" part, CASSIS shows the minimum and maximum frequencies found in the file. These values can be changed to display a subset of the original spectrum.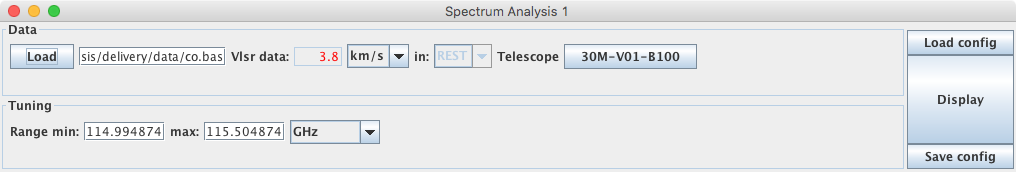
- Click on the Display button to display the spectrum.
Both methods lead to the same result:
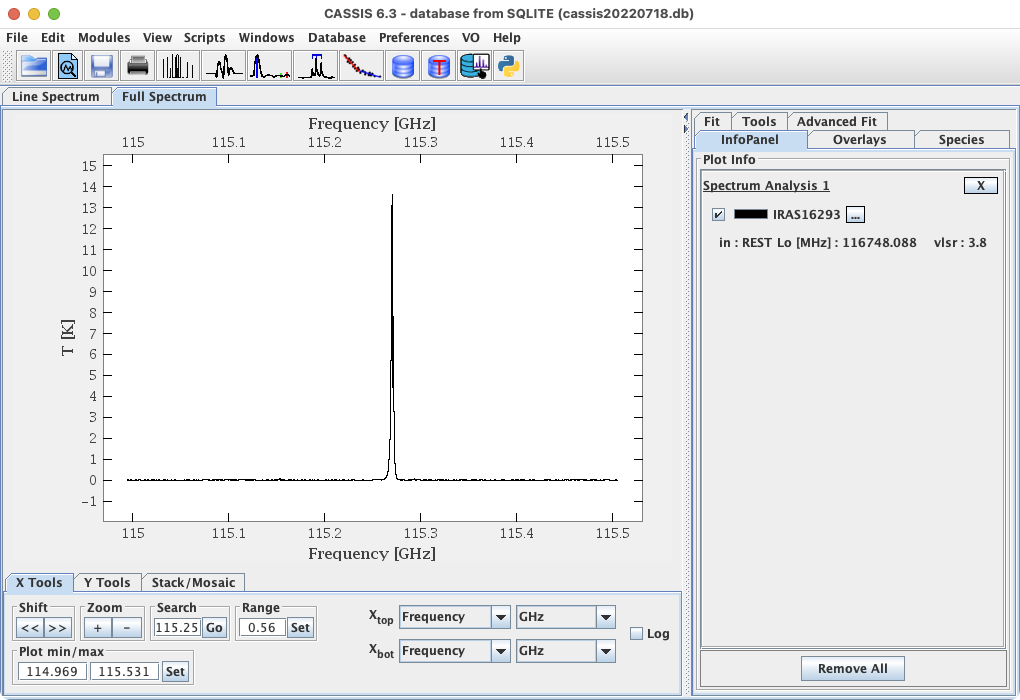
The functionalities are then described in Section 3.