Spectrum Manager and ASCII parser
| Contents |
Utility of the Spectrum Manager
The Spectrum Manager is used to manage all the spectra opened in CASSIS. For each spectrum, the user can visualize the associated metadata.
How does it work?
Click on the third menu, Modules, and choose Spectrum Manager.
Alternatively, click on the icon  .
In both cases, a pop-up window opens :
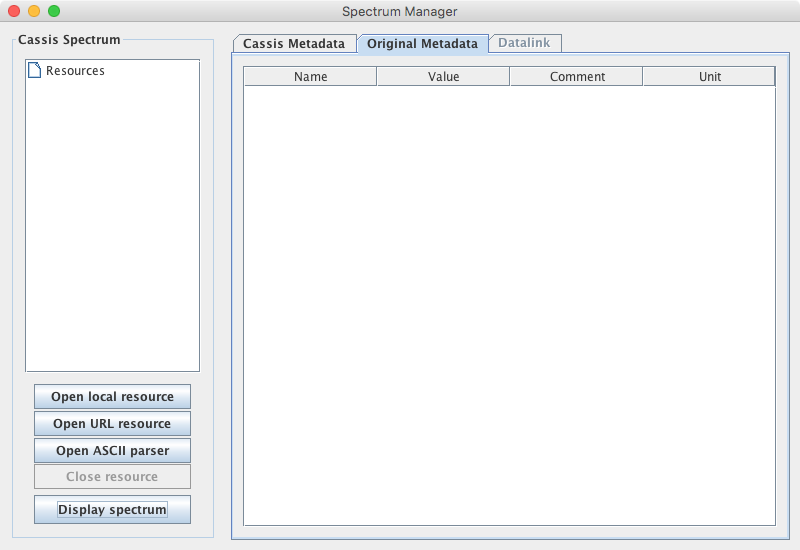
All the spectrum resources loaded in CASSIS will appear in the Cassis Spectrum panel.
You can open a spectrum in different ways :
- If you click on the "Open local resource" button, a file browser opens and you can select a spectrum file stored on your computer
- If you click on the "Open URL resource" button, you can enter the URL of the spectrum file
To visualize the spectrum, you can :
- Double click on the resource
- Click on the button "Display spectrum"
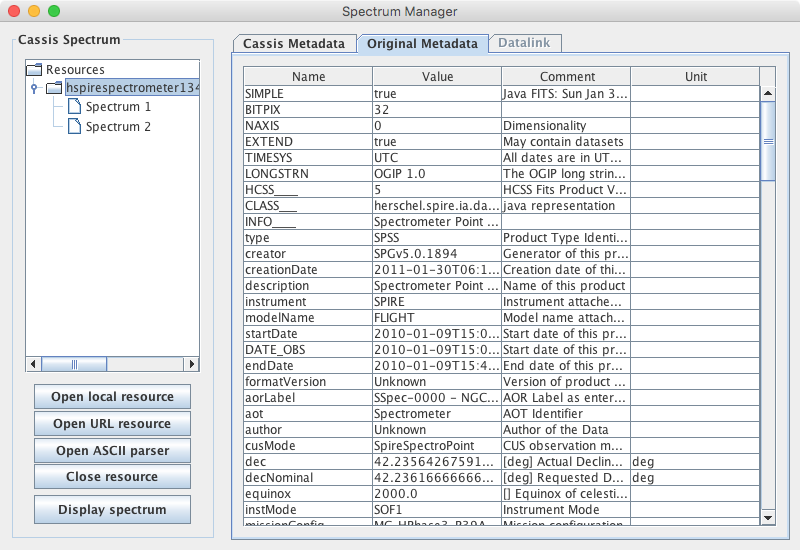
Tabs :
- Original Metadata: metadata read by CASSIS
- Cassis Metadata: metadata used by CASSIS to display the spectrum.
In this tab, you can obtain additional information on the spectrum (in particular min max for the x- and y-axes) by clicking on "Spectrum info".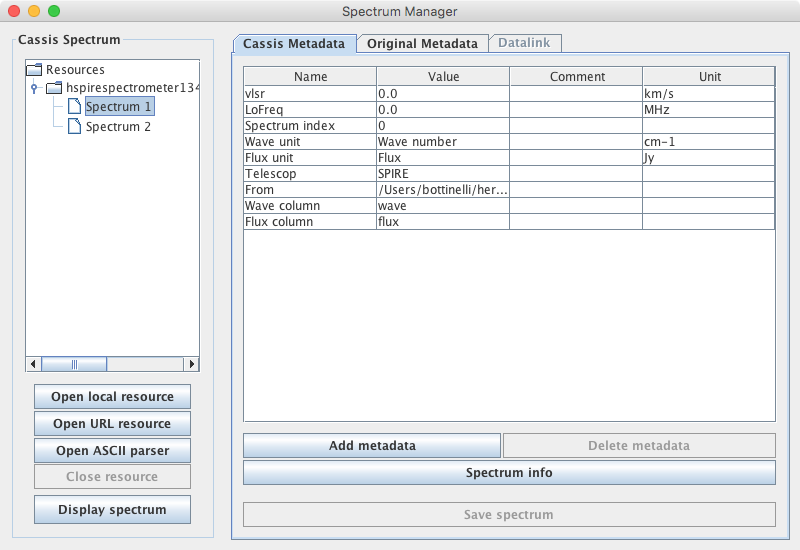
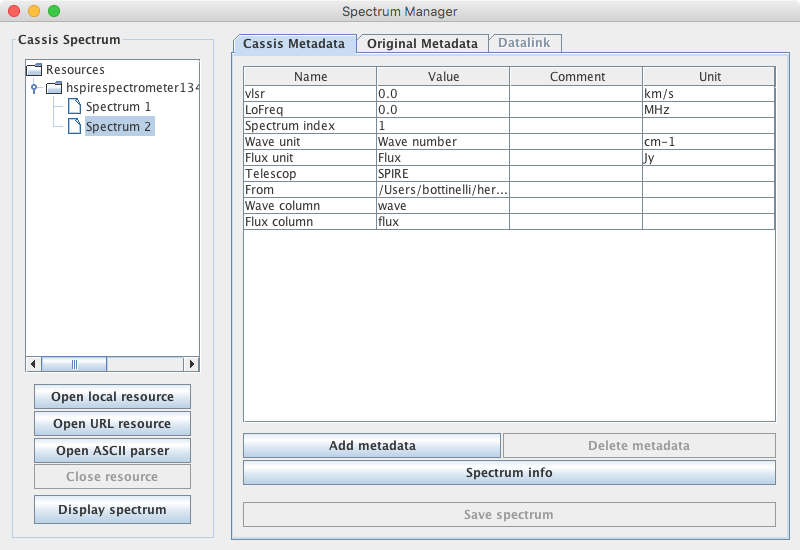
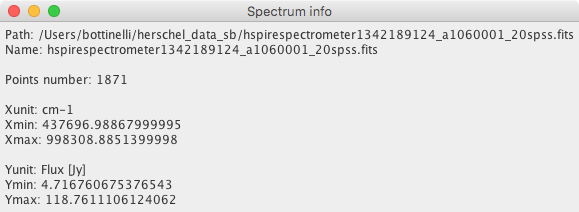
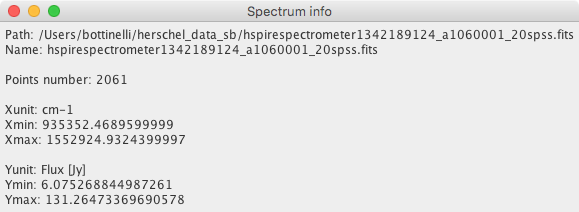
If you want to modify these metadata, double click on it or use the "Add row" and "Delete row" buttons. Caution : these functionalities have not been tested much.
When the user loads data from Spectrum Analysis module, Line Analysis module or Loomis Analysis module, that opens the Spectrum Manager to allow the user to open a spectrum file or to select a spectrum already loaded. and the "Display spectrum" button changes to "Select spectrum".
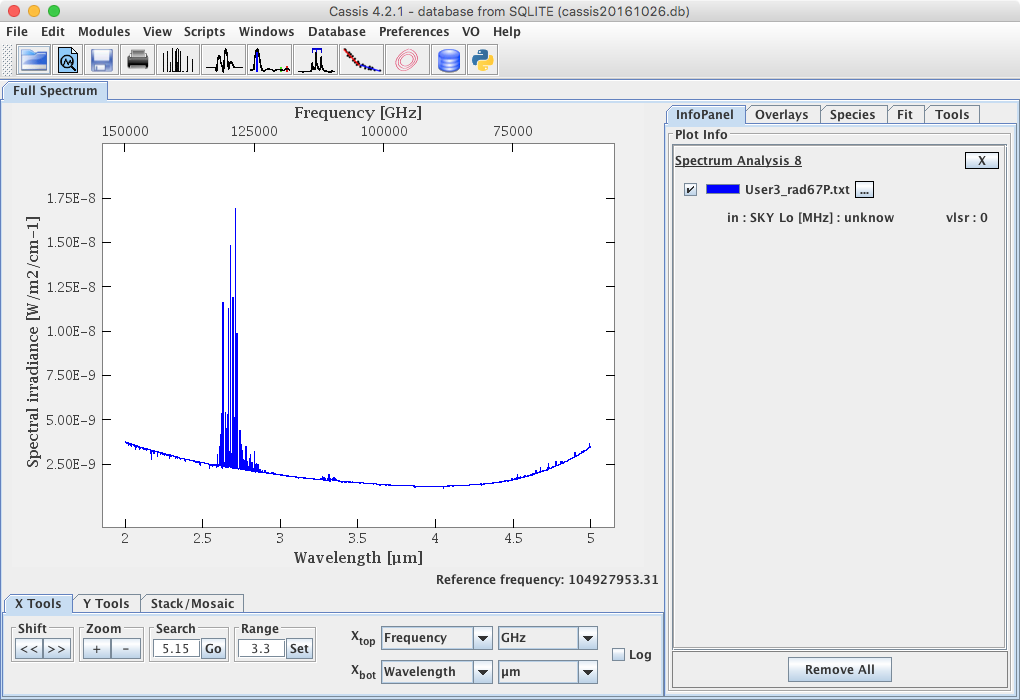
If the parameter "Force direct opening" (Configuration menu -> General Settings) is true , then when the user opens a spectrum file with the File -> Open menu, the Spectrum Manager will be automatically opened in the background and the spectrum will be directly visualized via the Spectrum Analysis module in the Full Spectrum tab of the main Cassis window.
The ASCII parser
If you get an error message when trying to open an ASCII file with the Spectrum Manager, or if you know you have a very specific ASCII format, you can use the "Advanced ASCII Reader" of CASSIS. To do so, in the Spectrum Manager window, click on Open ASCII parser and select your ASCII file. This will open a window like the one below :
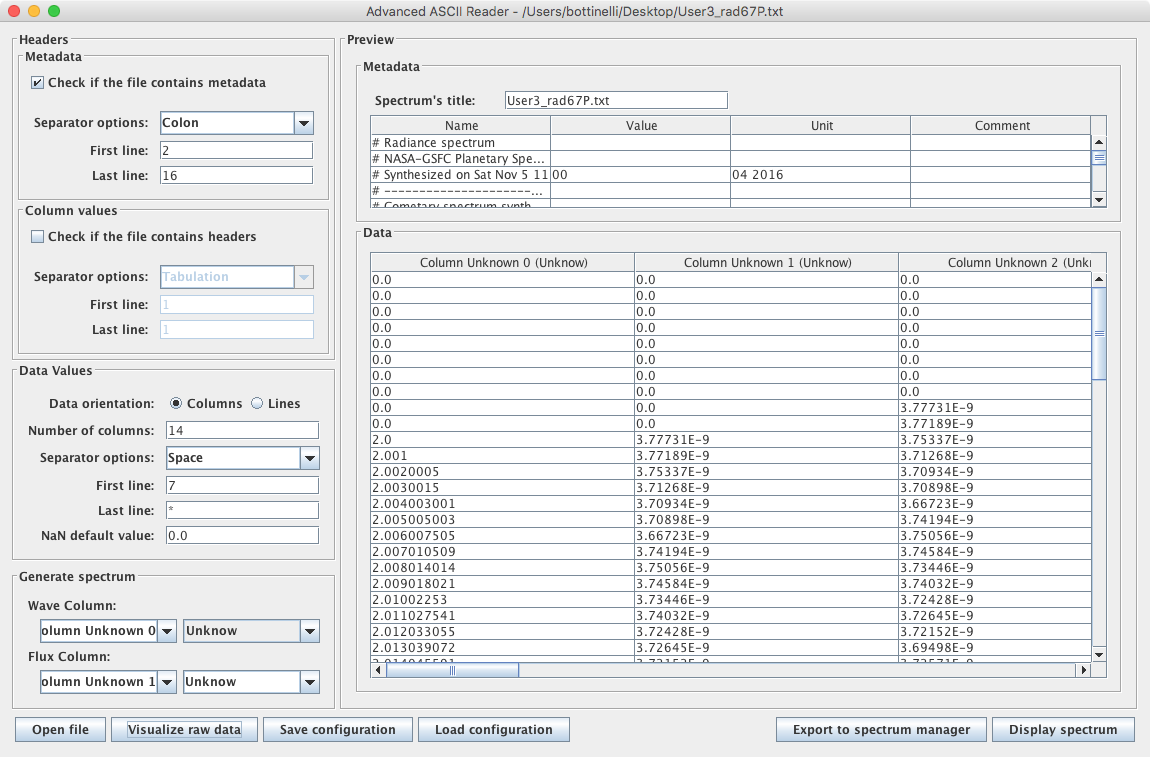
CASSIS tries to interpret the data automatically, and you can check the original file via the "Visualize raw data" button :
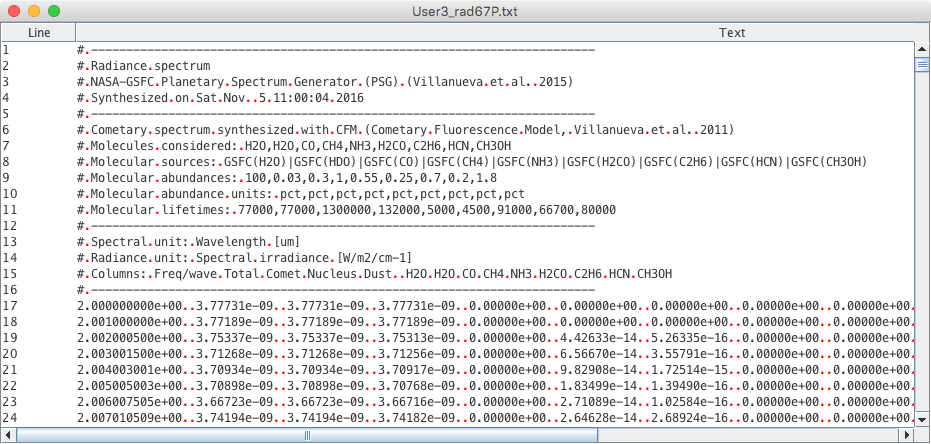
In this case, one can see that the first line of data should be 17 instead of 7. The user can also set column names and units for the x- and y-axes :
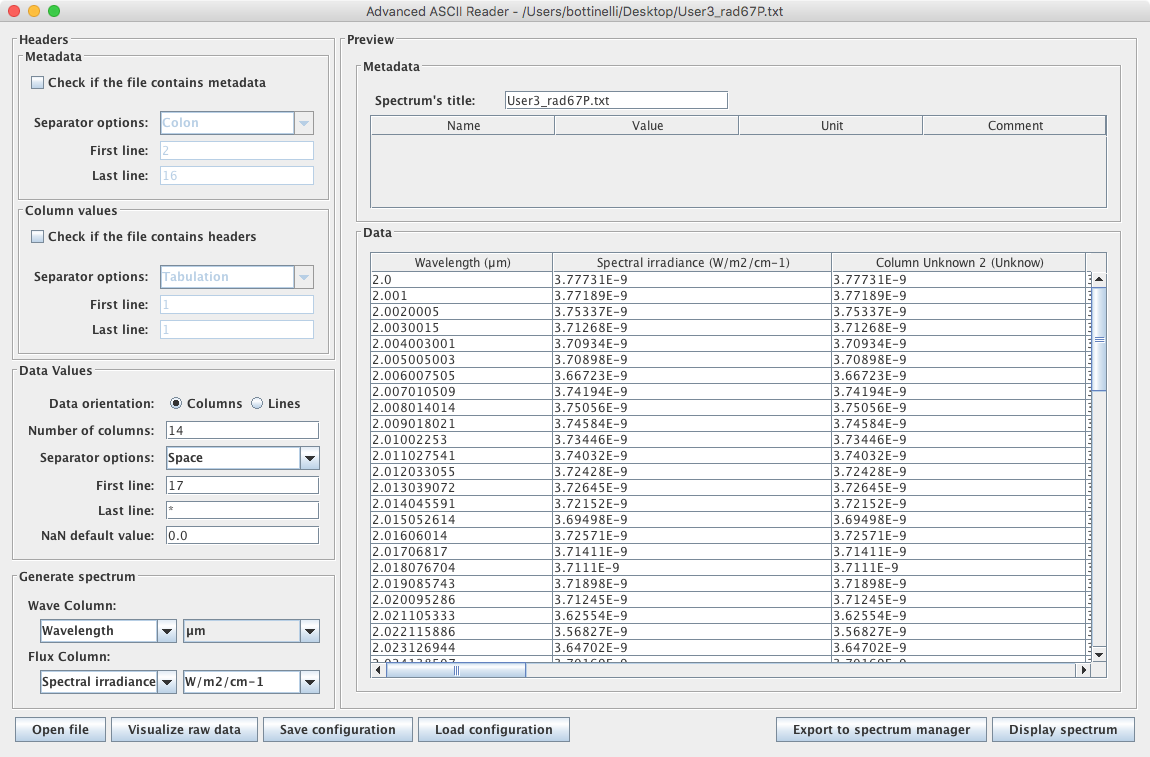
CASSIS will use this information to display the spectrum :
