


About CASSIS
| Contents |
How the document is organized
This on-line help is divided in seven main sections (left-hand side menu):- Modules: describes the different viewing and analysis tools available in CASSIS
- Common functionalities: a description of all the basics actions that can be performed in most CASSIS windows
- Databases: explains how to choose a database and how to create and manage templates
- Interoperability: CASSIS in the Virtual Observatory world!
- Scripts: some information about scripting
- Caveats and tricks: a list of encountered problems and how to solve them
- Video tutorials
Starting CASSIS and displaying a spectrum
To start CASSIS:
- if you installed the desktop version :
from a x-term, go to the cassis directory and type: ./cassis.run xxxx, where xxxx is the size in mega bytes
of the memory you want to allow to CASSIS (e.g., 1024, 2048, etc).
Just typing ./cassis.run, CASSIS will use by default 1 Gb of memory.
Warning : at the first launch, CASSIS may take a few minutes to setup. - if you chose the online version, just click on this link: https://cassis.irap.omp.eu/online/cassis.jnlp
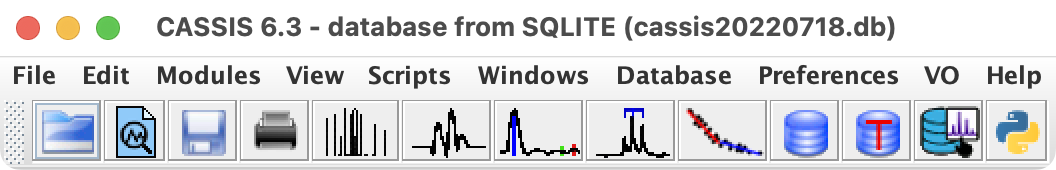
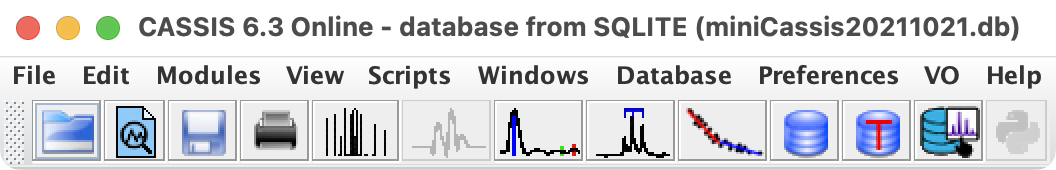
When launched CASSIS opens its main window:
Cassis 6.3 - database from yyyy (name_of_the_database),
or
Cassis Online - database from yyyy (name_of_the_database),
where yyyy is SQLITE or VAMDC (see the section 4 for more details).
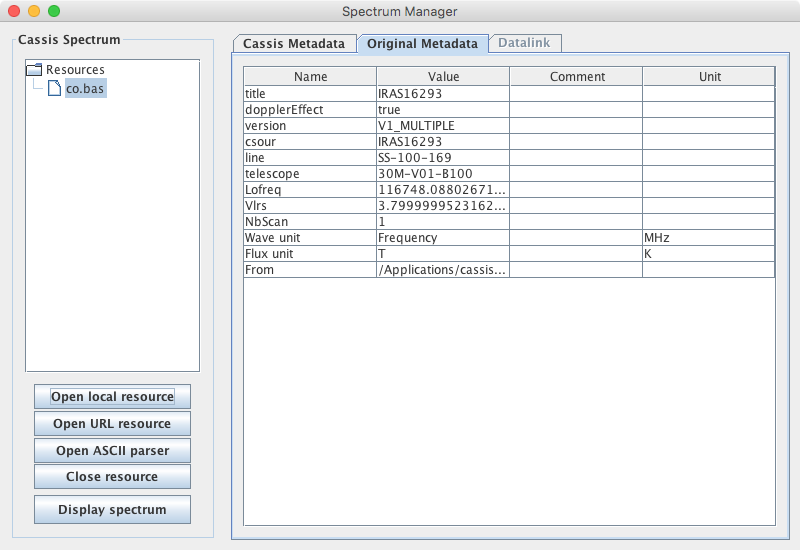
You can then start using CASSIS. For example, to display the CO spectrum which comes with CASSIS, follow these steps:
- open the Spectrum Manager (Modules > Spectrum Manager or
click on the icon
 )
) - click on "Open local resource"
- by default, you should be in CASSIS folder > delivery > data (if not go to this directory)
- select "CO.bas"
- click on "Display spectrum"
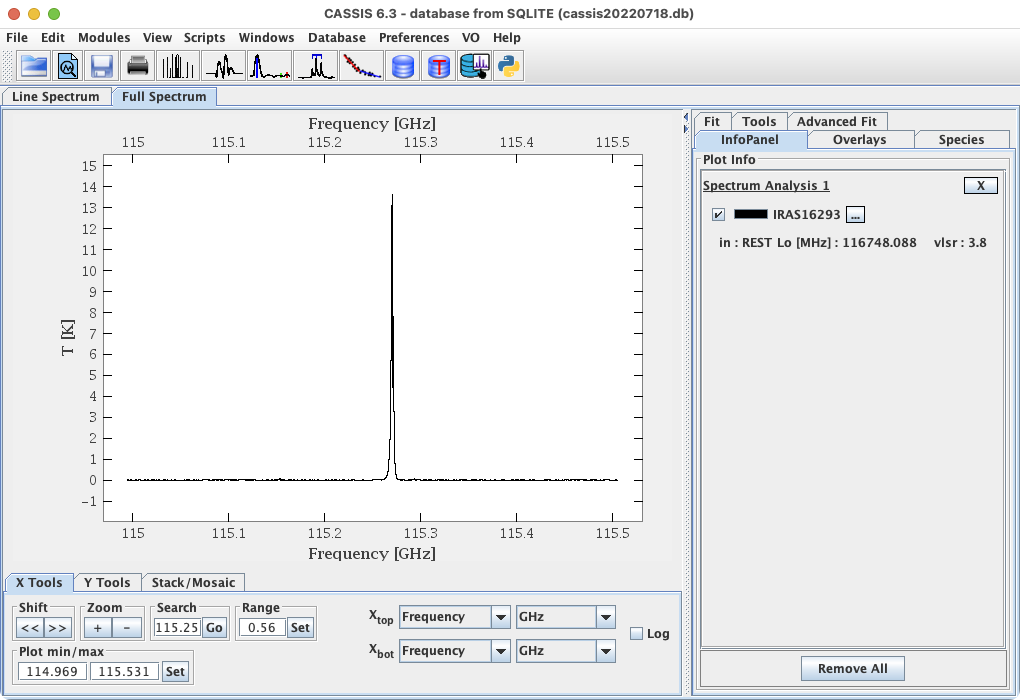
You can also load data via one of the views or modules described in Section 3.
For quick access to the modules and to some utilities, you can use the icons:
| Icon | Equivalent in menu bar | Description | More info |
|---|---|---|---|
 |
File → Open | Opens a window to browse for a data file ; CASSIS will open the file with the spectrum manager for inspection before display. | |
|
Modules → Spectrum Manager | Opens the Spectrum Manager | § 2.1 |
 |
File → Save | To save the displayed spectrum/spectra in one of the following formats: pdf, png, votable, fits, fus (full spectrum only), lis (line spectrum only), rot (rotational diagram only). | |
 |
File → Print | To send the current plot to a printer. Warning: currently does not work under Mac OS 10.9 and from the Line Spectrum tab (all OS) | |
 |
Modules → Spectrum Analysis | Opens the Spectrum Analysis window. | § 2.2 |
 |
Modules → LTE+RADEX | Opens the LTE+RADEX Analysis window. | § 2.3 |
 |
Modules → Loomis Wood | Opens the Loomis Wood Analysis window | § 2.4 |
 |
Modules → Line Analysis | Opens the Line Analysis window | § 2.5 |
 |
Modules → Rotational Diagram | Opens the Rotational Diagram window | § 2.6 |
 |
Database → Database settings | Opens the "Database Settings" tab of the preferences pane | § 4.1 |
 |
Database → Manage Templates | Opens the database template manager | § 4.2 |
 |
Scripts → Jython | Opens the jython scripting window | § 6 |
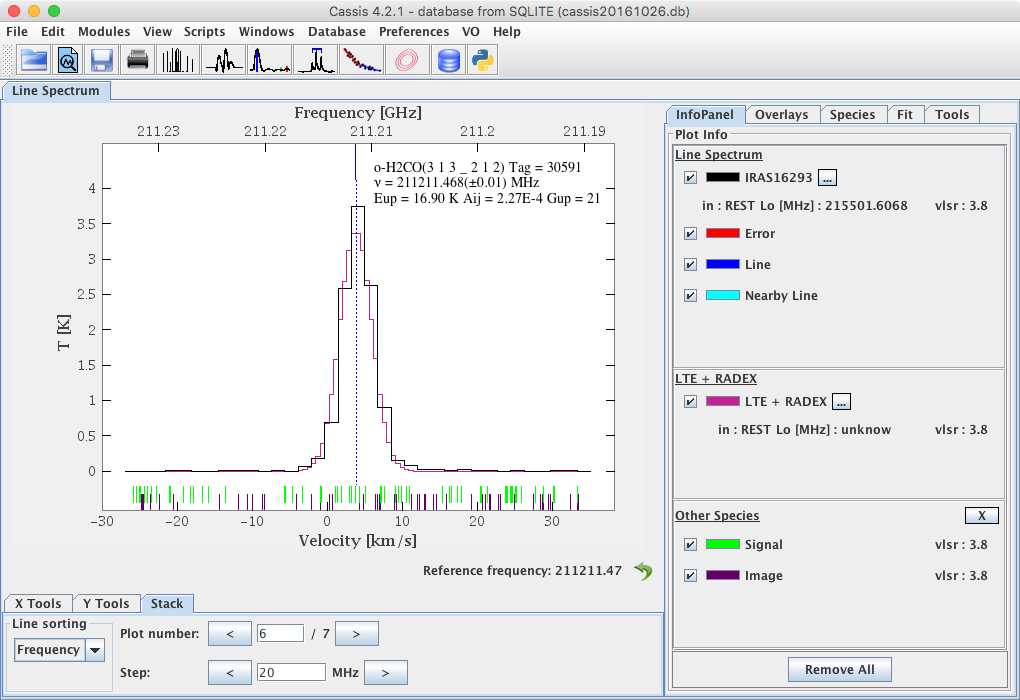
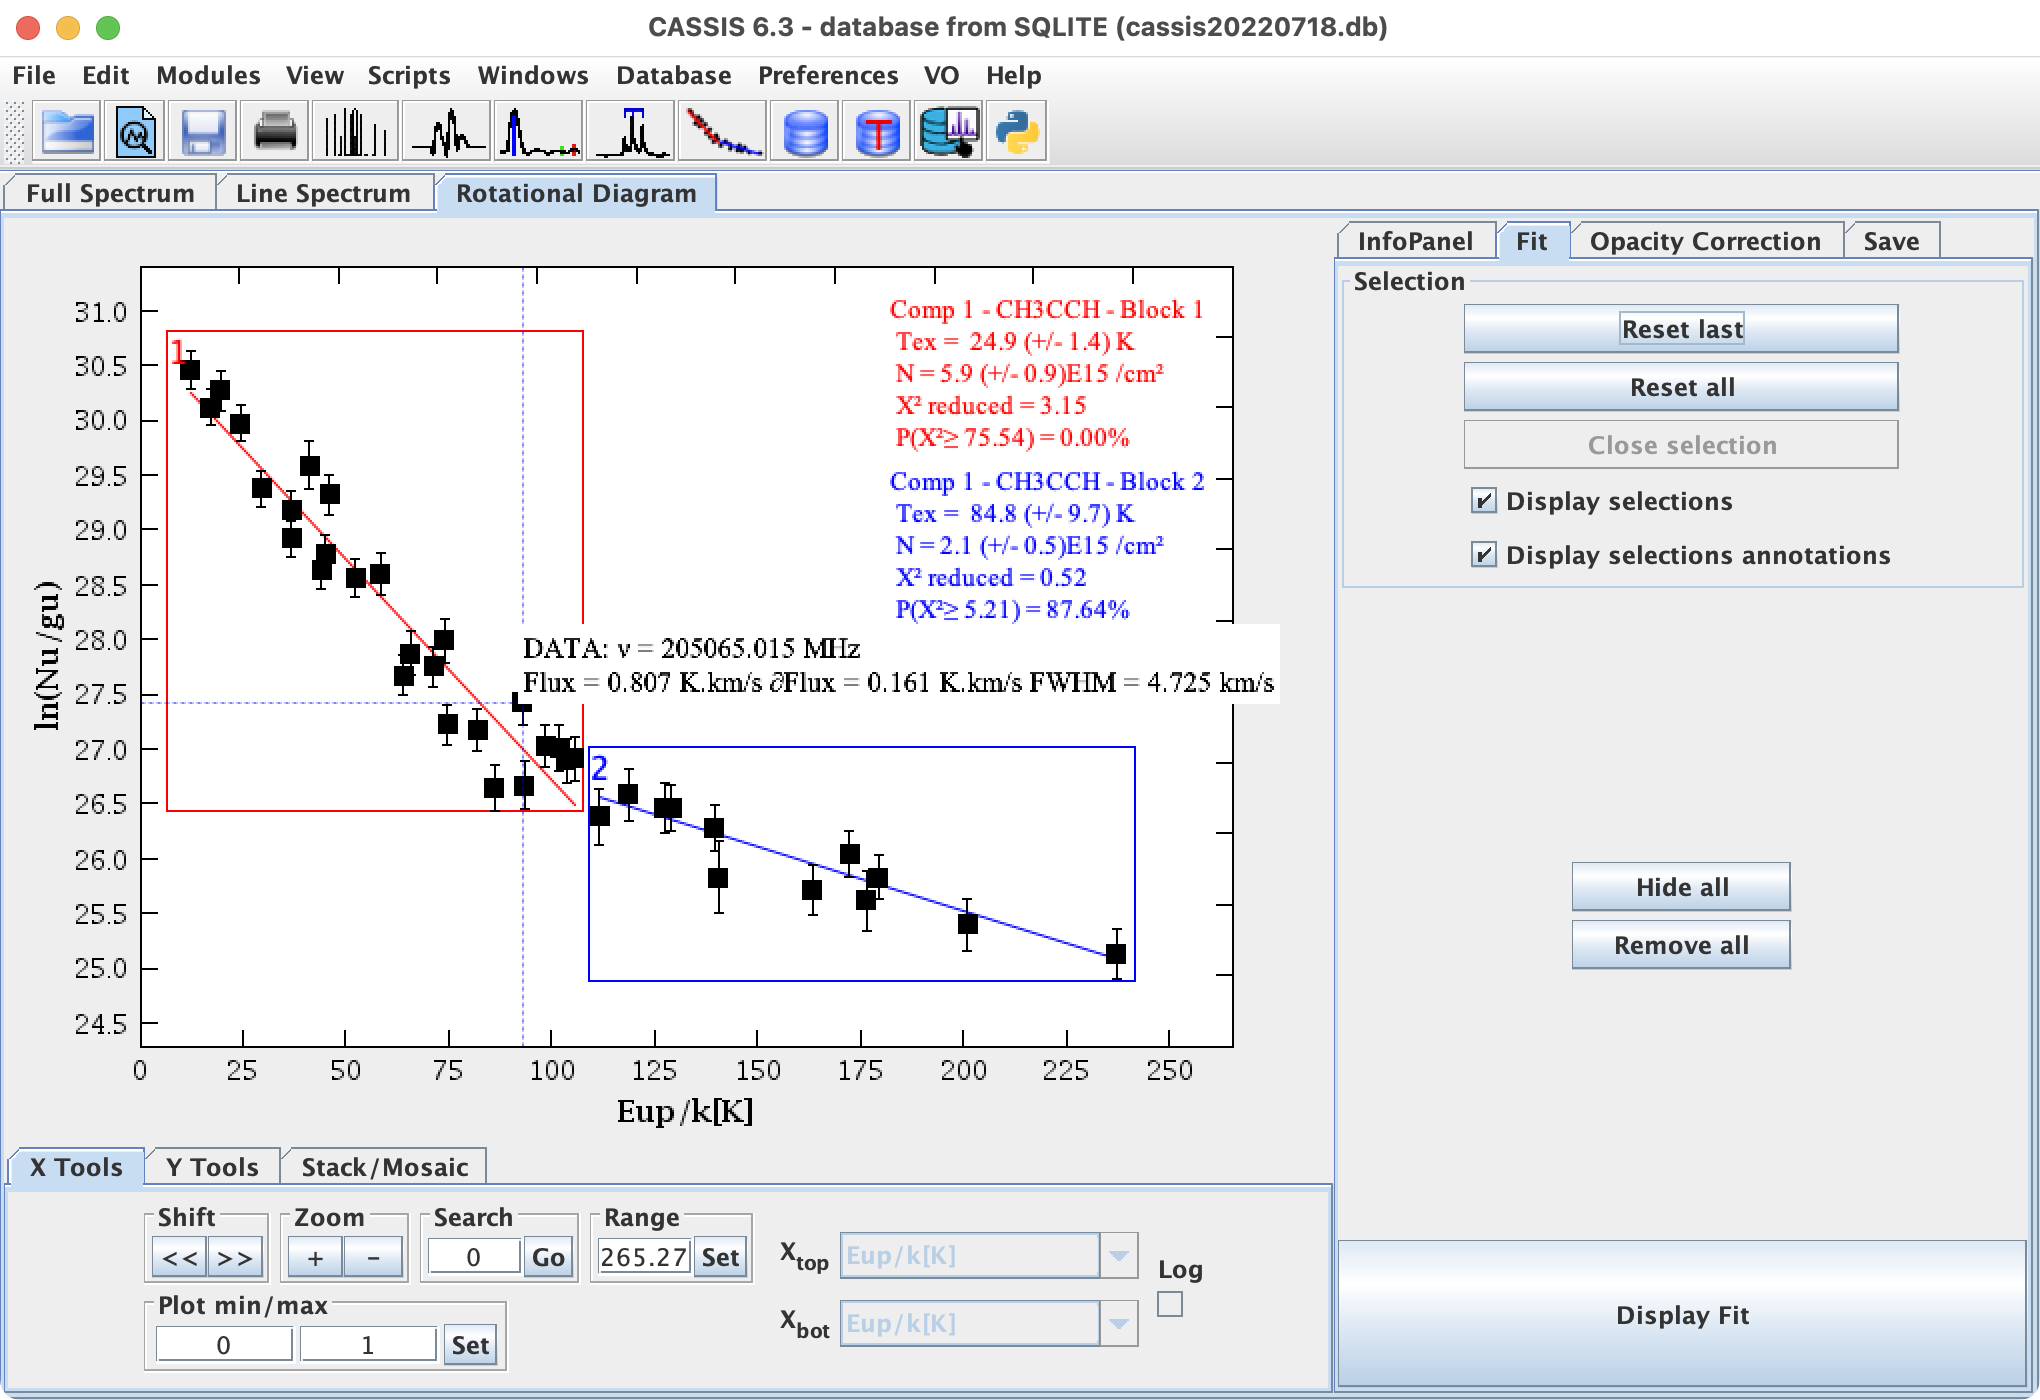
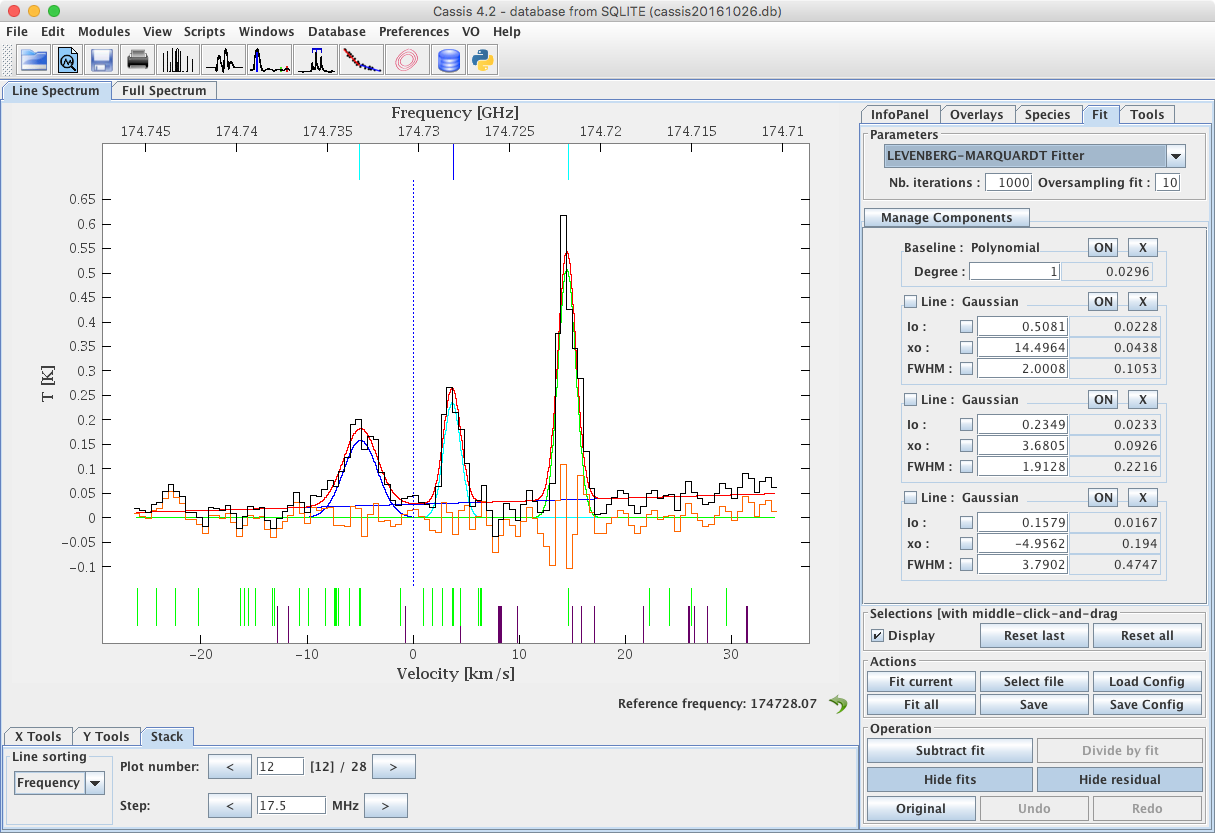
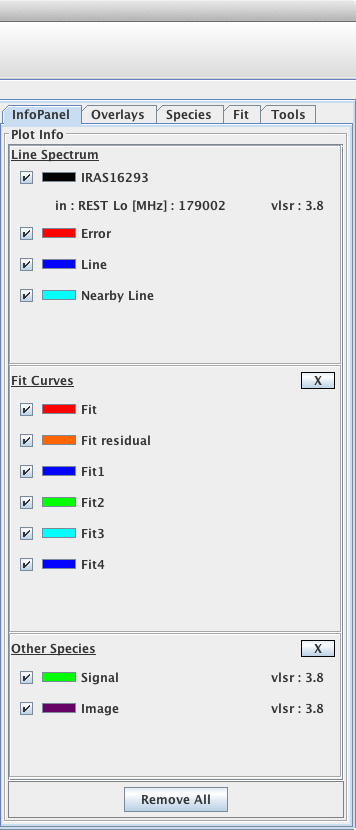
Snapshots
 |
 |
 |
 |
Copyright Notice
If you use CASSIS to publish some results, please do not forget to cite the following :- If you used only the LTE model:
"Based on an analysis carried out with the CASSIS software and the XXX spectroscopic databases. CASSIS has been developed by IRAP-UPS/CNRS (https://cassis.irap.omp.eu)."
where XXX should be replaced by the following database(s), depending on which one(s) you used :- JPL database : http://spec.jpl.nasa.gov/
- CDMS database : http://www.ph1.uni-koeln.de/cdms/
- LSD database : https://lsd.univ-lille.fr/
- NIST database : http://physics.nist.gov/PhysRefData/ASD/
- If you used the RADEX model:
"Based on analysis carried out with the CASSIS software, the XXX spectroscopic databases, the YYY molecular databases, and the RADEX code. CASSIS has been developed by IRAP-UPS/CNRS (https://cassis.irap.omp.eu)."
where XXX is as above, YYY should be replaced by the following database(s), depending on which one(s) you used :- LAMDA database : http://www.strw.leidenuniv.nl/~moldata/
- EMAA database : https://emaa.osug.fr